
You know what? It’s hard: being overstimulated, that is. Not only with trading and investing, being constantly bombarded with whatever X Substack Bro and X anon is saying about the stock market (the hanging man monthly candle bro!), but just in life (I think I read somewhere we see on average about 5-10k advertisements daily). It’s a lot. And then on top of that, add group chats, personal life, relationships, work, kids; I don’t think we talk enough about how on a day-to-day basis the average human being is probably stressed out to the max (maybe be a little friendlier to that neighbor, he could have been short SPY in 2025). Now throw in trading options into all of that, and my heart just palpitated thinking about it all.
Anyways, my point is this: as a person who has taken significant losses and learned from them (I am pretty sure this blog would not exist if I hadn’t blown up), the goal is to make money and sleep at night. Nobody is trying to bet their son’s college fund on Stonks and Whatnot‘s SPY call (seriously guys, don’t). I’m just here to try and make sense of the “vibe” (which is actually a thoughtfully structured thesis of in-depth technical analysis and years and years of experience some might called strategic gambling, but whatever, to each his own).
The reformed investor / trader might take a look at SPY here and see of course all-time highs recently, and maybe a “bubble”, as famed investors are calling for a crash at the highs. But for me, as more of a “new school” trader, one phrase rings true to me here: PAST PERFORMANCE DOES NOT INDICATE FUTURE RESULTS. Just because the market crashed in ’08 does not mean it’s going to crash in 2025. It’s a completely different market. People are investing at record numbers with apps like Robinhood. Hell, people are making trading their full-time gig (despite what Elizabeth Warren might have to say about it!). Citadel pays top dollar for retail flow. Not to mention, every dip gets bought since, well, the history of time (sorry, bears!).
Looking at the daily chart on SPY I see an inverse head and shoulders forming on the daily with a 10DMA cross about to be official holding a nice support above $675. I’d be looking for the previous ATH $689.70 for a big move to start as the main resistance, but first there is a tiny bit of pressure above $685. The play could be invalidated below $677, however that would be the ultimate support / retest level in the short-term (for the longer-term it would be closer to the 10DMA $672 (and maybe even $670).
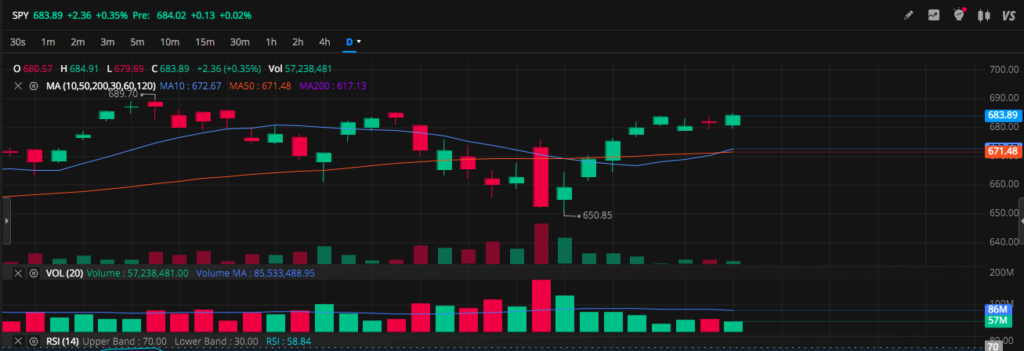
What I do find interesting and hard to ignore is that GIANT red candle on November 20th (what WAS that?!) and sharp and quick reversal boomerang from $650 back to $683, igniting the fuel for the Santa Rally to ensue.
So, how to play it? I have a few ideas, depending on the time frame. It’s already December 4th, so those December 19th expiration options are closer than you think. A more conservative options trader might be looking further out to January or even spring / summertime.
- Short-Term: December 19th $690 calls + $675 puts
- Medium-Term: January 16th $700 calls + $670 puts
- Long-Term: March 20th $720 calls + $650 puts
If I had to pick a “side” I would definitely say I am leaning bullish and we might even see $700 this year with the setup I’m looking at. I do not see the crash everyone is talking about (but I’m also not getting paid to post, so there might be something to be said about bear porn engagement).
Whatever happens, happens. I’ll be sure to bookmark this post for 2 months out to see where we stand.
(this post was, in fact, written by a human)