
When it comes to the daily chart, I am always looking for some sort of indicator or pattern, whether it be bullish or bearish. Like for example: the cup and handle on the macro—which we have went over previously with gold, Palantir, Hims and Hers, Bitcoin—or other charts such as the inverse head shoulder and bull / bear flag, etc.
Now, after gold had a massive run since end of 2023 and a cup and handle on the macro, I am reevaluating its recent correction and bounce off of the 50DMA for another wave up even higher to see my price target of $3600-3800 (or $325-330 for GLD ETF respectively).
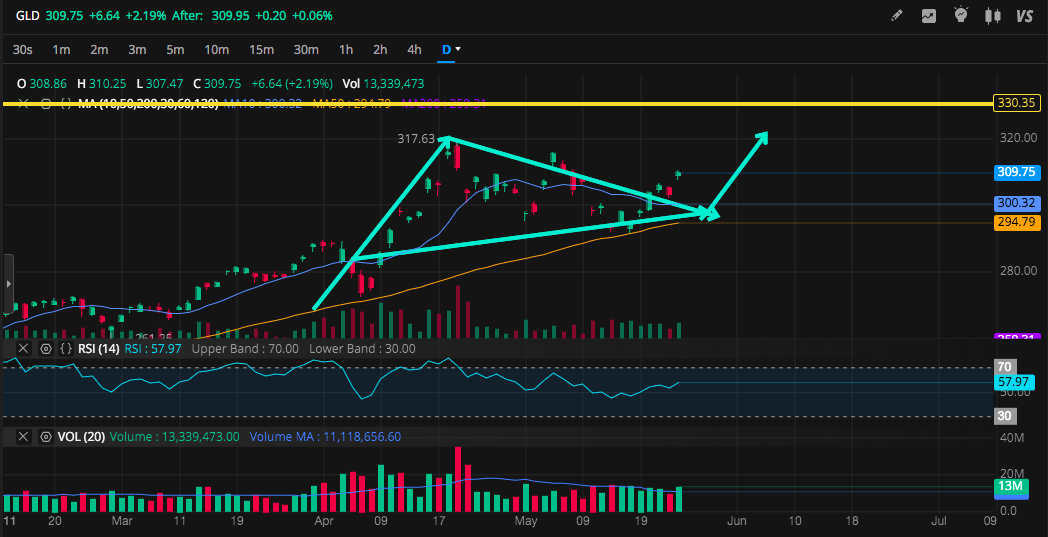
I was looking at the chart every day last week and there were some big prints coming up on the volume, and I noticed the daily chart was flagging since about April 8th of this year which has me bullish as long as it can withold its 10 + 50DMA.
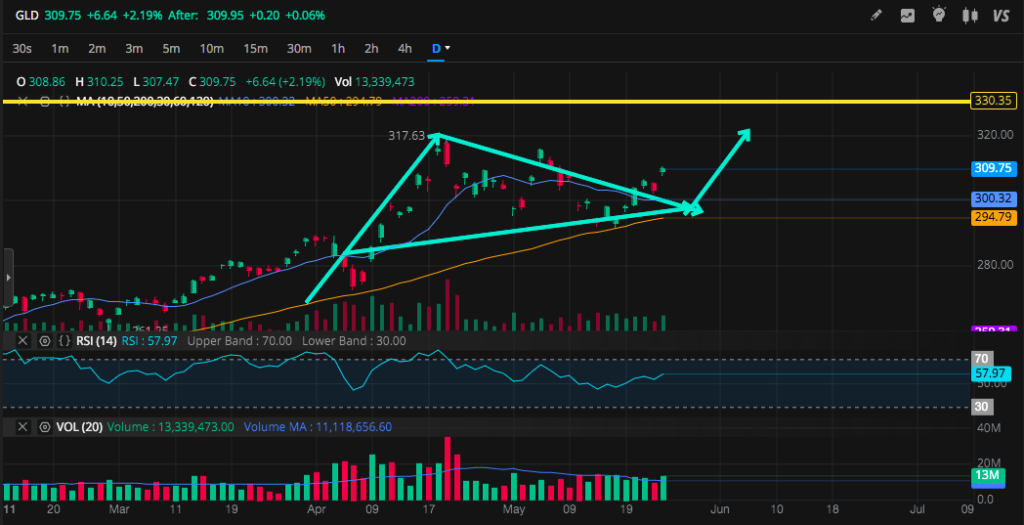
If I had to make a guess based on the charts, I would estimate gold will see new highs into the early summertime. There are a few paths I see for the name, and these levels will be key for either direction:
Gold Futures
bullish: 3350, 3375, 3400, 3425, 3509
bearish: 3310, 3275, 3250, 3225, 3200
GLD ETF
bullish: 310.50, 314, 318.00
bearish: 306, 302, 300, 298